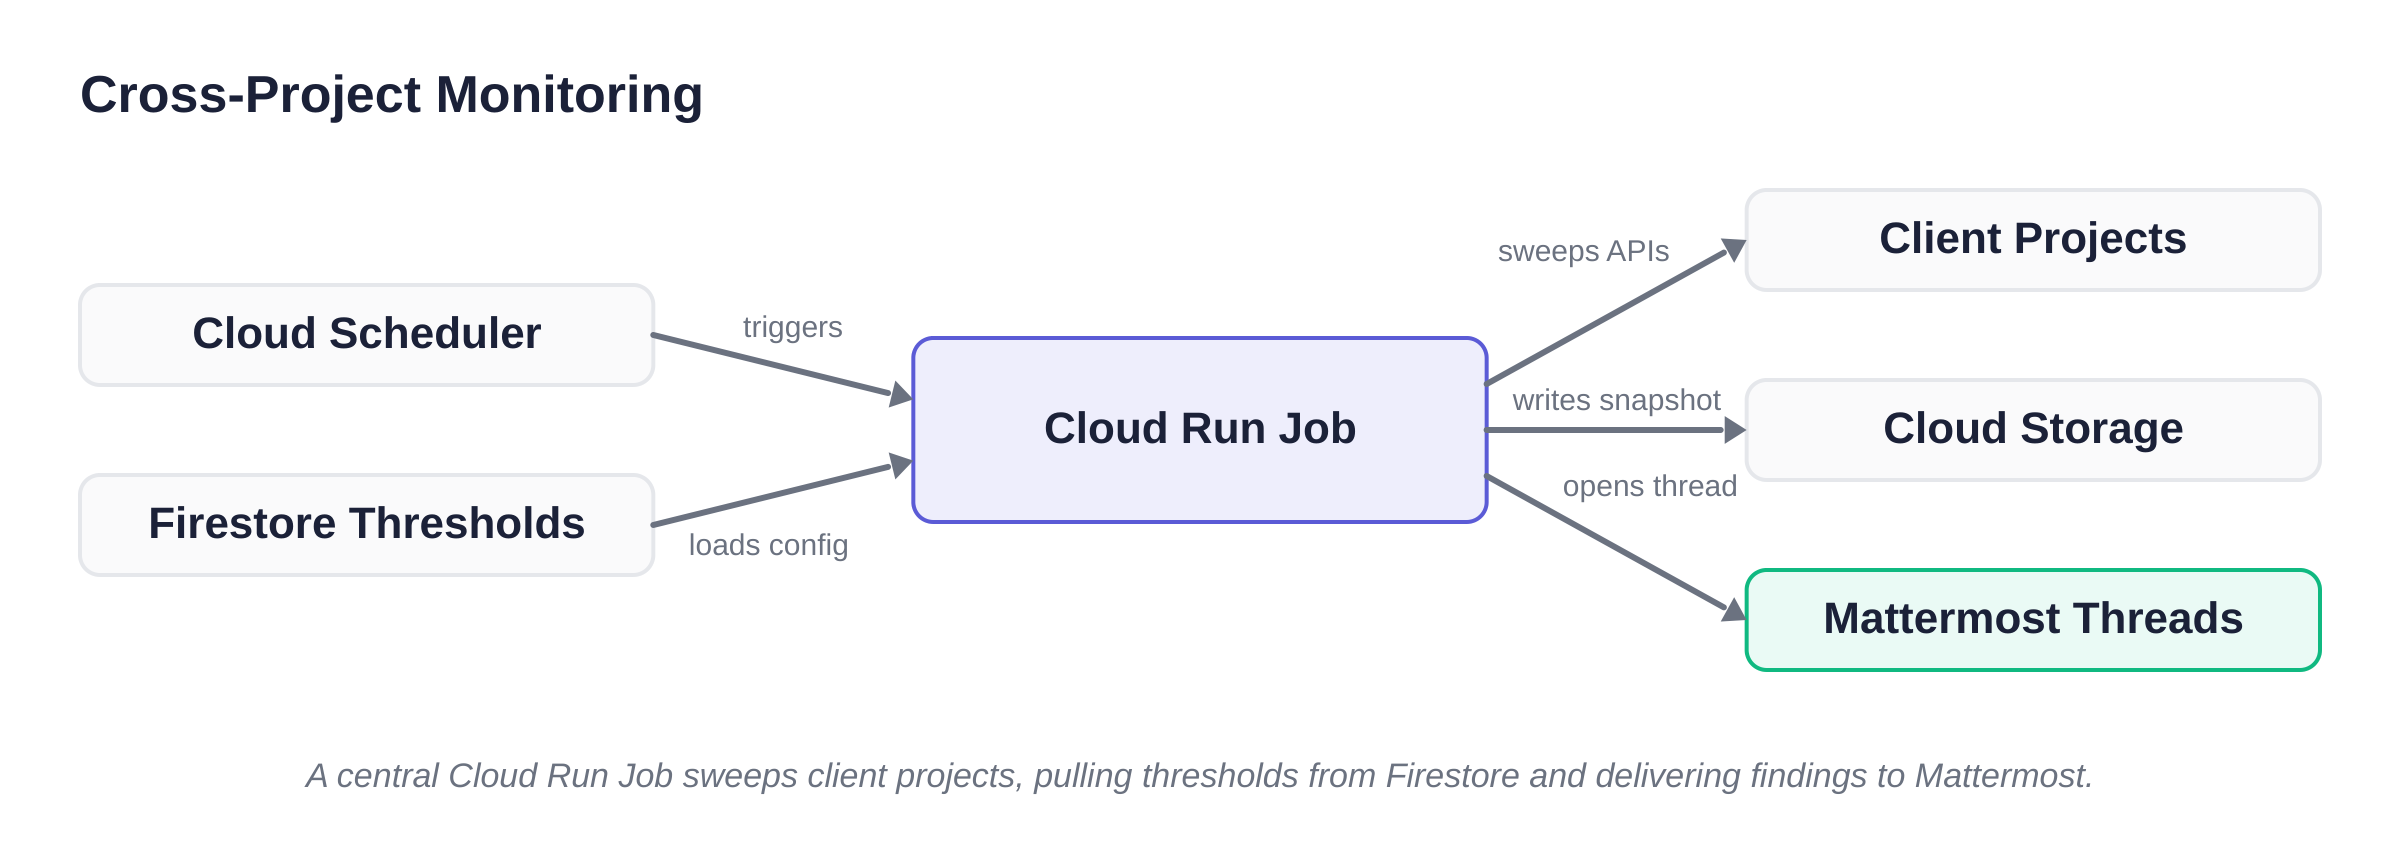
To monitor our client fleet, I built a cross-project observability platform: a central Cloud Run Job triggered every two days by Cloud Scheduler to execute ~60 rules across nine areas against per-client Firestore thresholds. It reaches into each client’s environment to evaluate their state, saves snapshots to Cloud Storage to power a Next.js dashboard, and dispatches a Mattermost bulletin with a thread per client. But the most important design decision had nothing to do with how the rules were evaluated. It was about what happened when a check failed to run at all.
Cross-Project Visibility Is Fragile
When a central service monitors external infrastructure, the connection between the observer and the target is inherently brittle. To read a client’s metrics, list their resources, or inspect a cluster, the monitoring sweep needs authorization to reach across the project boundary.
Because these are client projects, that access is never guaranteed to stay intact. A client might run an infrastructure-as-code deployment that accidentally overwrites a policy, quietly dropping the observer’s access. A developer might disable an API that they did not realize was required for the central tooling. The network path might break, or a security perimeter might suddenly block external reads.
When an observer loses access to a target, the tool executing the sweep encounters an error. It cannot read the state it was asked to evaluate. The crucial question for the platform is how it handles that specific failure.
The naive approach is to catch the error, write it to the central logging system, and continue with the next check. The execution loop logs the access denial and moves on to the next project, ensuring the sweep as a whole finishes successfully.
But this creates a dangerous failure mode. When the job finishes and generates the final report, the missing section is simply empty. There are no alerts about that specific area. To the engineer reading the output, an empty alert list means everything is healthy. The silence is interpreted as a passing check. You think the system is stable, but in reality, you are just blind to it.
Silence Is a Finding
In an observability system, an area that could not be checked is a finding, not silence. A broken permission that stops a check from running is just as critical as a failing metric, because it hides the actual state of the infrastructure from the people responsible for it.
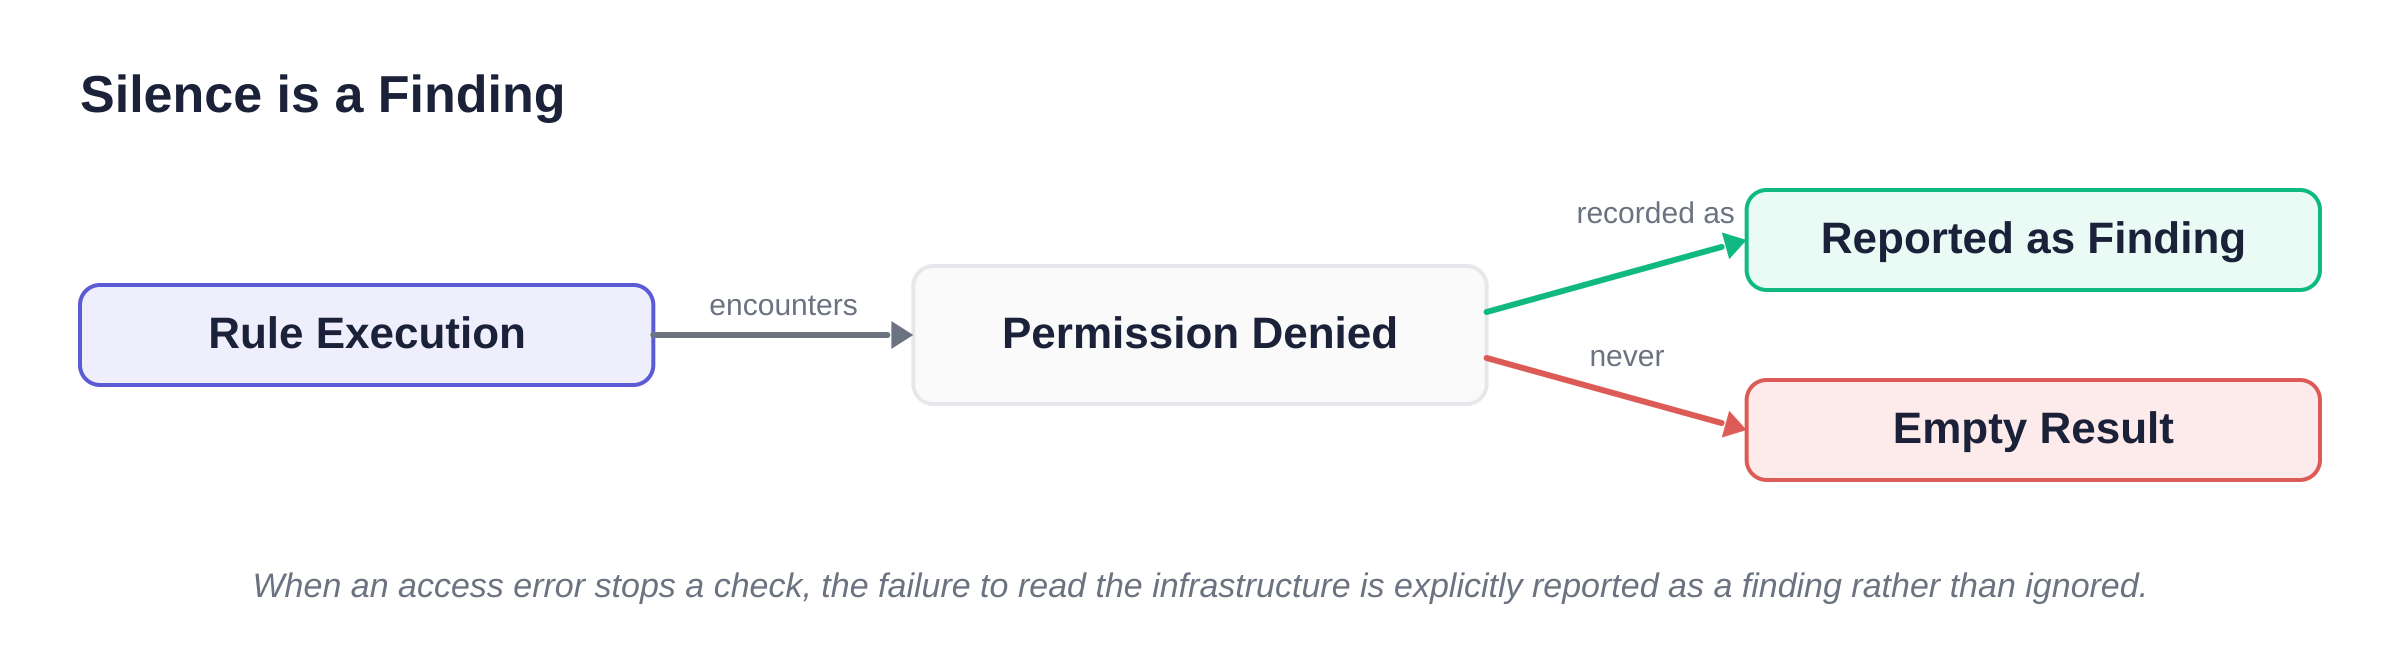
To enforce this, the execution logic must guarantee that an inability to read data does not result in an empty list of violations. If the sweep attempts to evaluate a rule and encounters an access error, it cannot quietly log the failure and return an empty array. The error itself becomes the violation.
This transforms a silent operational failure into a visible, trackable infrastructure finding. By treating the inability to monitor as a first-class failure, the report explicitly warns the engineering team that their visibility is broken. The platform refuses to let a lack of data masquerade as a clean bill of health.
The Thresholds Vary by Client
The monitoring platform applies this rigor across roughly 60 rules, categorized into the nine operational areas: Billing, Pub/Sub, Cloud Run, Firestore, Cloud Storage, Logging, Quotas, GKE, and IAM.
Crucially, the definition of a failure varies by client. A baseline metric that represents an emergency for a small proof-of-concept project might be the normal operating state for a heavy production workload. If you apply the same strict rules to every environment, you drown in false positives from the large clients while missing genuine anomalies in the small ones.
These per-client thresholds are stored in Firestore. Before the sweep begins evaluating the rules against a specific project, it loads that client’s configuration to determine exactly where the boundaries lie. Gathering the data accurately depends entirely on comparing the raw metrics against the specific context of the environment they belong to.
But evaluating the rules is only half the battle. A monitoring sweep across an entire client fleet generates a vast amount of state. The other half of the problem is delivering that state so that engineers can actually act on it.
The platform handles the raw data by writing snapshots to a Cloud Storage bucket, creating a historical record of the fleet’s condition over time. The Next.js dashboard on Cloud Run provides a persistent visual layer for the team to check. However, the active alerting requires a different approach entirely.
The Delivery Must Group by Context
A common mistake with alerting bots is dumping every finding into a single channel. When a central observer sweeps a dozen projects and finds issues in four of them, dumping all the alerts into one timeline creates an unreadable wall of text. Separate issues blur together, and teams quickly develop alert fatigue, ignoring the channel because the noise is too high to parse.
Instead, the service delivers the results to the team via Mattermost using a structured hierarchy. It posts a single bulletin to the main channel announcing the completion of the sweep. Then, it creates a thread under that parent message for each affected client.
All findings for a specific client are contained within their dedicated thread. If the observer lost access to a project’s metrics, the thread for that client states explicitly that an area could not be reached.
By organizing the findings into a thread per client, the engineers have a focused place to acknowledge the alert, discuss the fix, and coordinate with the client. It creates an isolated incident response room for that specific project, entirely separated from the noise of the rest of the fleet.
What I would tell someone building this
- Assume your access will break. When you monitor infrastructure across project boundaries, cross-project access is a fragile dependency. Design your observer to expect missing permissions and disabled APIs as a routine operating condition, not an impossible edge case.
- An area you could not check is a finding. The most dangerous thing an observability tool can do is fail quietly. If a check cannot complete its work, the output must loudly declare that the area is unmonitored. Never let an empty array imply that a system is healthy.
- Decouple the sweep from the active alerts. Hitting cloud APIs is slow and subject to rate limits and transient failures. Run the sweep as a scheduled batch job, write the results to a bucket, and use the persistent snapshot to power your dashboards.
- Thread your notifications by context. A single stream of alerts guarantees alert fatigue. Grouping findings into a dedicated thread per client scopes the conversation and prevents independent failures from burying each other.